Development status of plastics recycling
![2 Plastic waste disposal 2016 and 2040 [2]](https://www.recovery-worldwide.com/imgs/1/8/0/9/0/0/0/02_Harder_rec_04-2022-1e8984c8e9c16a2f.jpeg)
![3 Comparison of important parameters [2]](https://www.recovery-worldwide.com/imgs/1/8/0/9/0/0/0/03_Bild3L_2040-2-a1de5f30b38072e0.jpeg)
![5 Plastic consumption in Europe by industries [3]](https://www.recovery-worldwide.com/imgs/1/8/0/9/0/0/0/05_Bild5L_Plastics_-_the_Facts_2020_-2-1963f86e0ac632e3.jpeg)
![6 Plastic consumption in Europe by polymers [3]](https://www.recovery-worldwide.com/imgs/1/8/0/9/0/0/0/06_Bild6LL_Plastics_-_the_Facts_2020_-1-714f1b7c2454f2e8.jpeg)
![7 System change for plastics [2]](https://www.recovery-worldwide.com/imgs/1/8/0/9/0/0/0/07_Bild7L_2040-d6cd542ffda8b093.jpeg)
![8 Plastic disposalin Asia [4]](https://www.recovery-worldwide.com/imgs/1/8/0/9/0/0/0/08_Bild8L_EurasiaGroup-3d8c8c101591df09.jpeg)
![9 Recyclable plastic packaging [5]](https://www.recovery-worldwide.com/imgs/1/8/0/9/0/0/0/09_Harder_rec_04-2022-afadd1acc077fce2.jpeg)
![10 Disposal in the EU [6]](https://www.recovery-worldwide.com/imgs/1/8/0/9/0/0/0/10_Harder_rec_04-2022-b3ac843d3c4763b4.jpeg)
![11 Material stream pattern in Germany [8]](https://www.recovery-worldwide.com/imgs/1/8/0/9/0/0/0/11_Bild11L-a0e5832817b1db36.jpeg)
![12 Process stages in mechanical recycling [9]](https://www.recovery-worldwide.com/imgs/1/8/0/9/0/0/0/12_Bild12L_Verfahrensschema-4156d784e51d69ad.jpeg)
![13 Recycling of various plastics [2]](https://www.recovery-worldwide.com/imgs/1/8/0/9/0/0/0/13_Bild13_Stand_der_Technik-6ad7ec3f4d498969.jpeg)
![18 CO2 footprint of various processes [2]](https://www.recovery-worldwide.com/imgs/1/8/0/9/0/0/0/18_Bild18L_pathways-30d18b0ecff8ed19.jpeg)
Environmental reports often mention the goal of a recycling economy. That is supposed to count for the plastics industry, too, based specifically on extensive recycling of plastic waste. The reality on the other hand presents a very different picture. The global recycling rate is well below 10 %. This market overview provides figures on this topic and examines the current challenges, enabling deeper insights into the situation today. Aspects such as bridging technologies and downcycling are also addressed.
1 Introduction
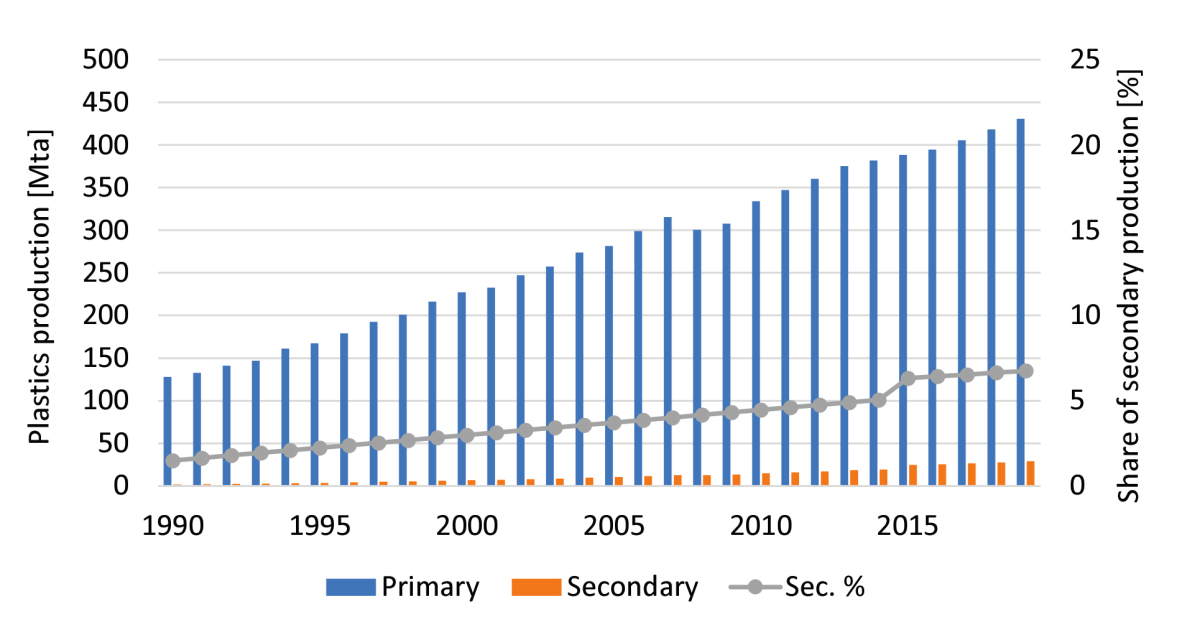
The global production of plastics rose from 130 million tonnes per year (Mta) in 1990 to 460 Mta in 2019. That is a 2.5-fold increase. The percentage of secondary plastic, i.e. plastic that has undergone material-to-material recycling, has increased from 1.5 % to 6.8 % (Fig. 1). Nevertheless, the recycling rate lags well behind the expectations of the recycling industry, policy makers and especially public perception in western industrial countries. That is the finding of a recently published OECD (Organization of Economic Co-operation and Development) from 2022 [1]. This is outweighed, however, by the realization that, on a global scale, much more plastic waste is subject to mismanagement and environmental pollution than the volumes of waste that are actually recycled.
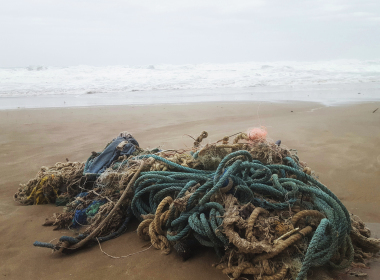
Fig. 2 shows how dramatic the situation will get by 2040 if we persist with ‘business as usual’ [2]. Shown in the figure are the streams of plastic waste with 2016 as a reference year. It can be seen that uncontrolled disposal of plastic waste accounts for a large percentage and by 2040 will account for the main part of plastic waste if there is no significant intervention. Moreover, the volumes of waste being recycled are not even half as high as the volumes landfilled either. The volumes of waste that are incinerated in an uncontrolled process or pollute the earth (rivers and lakes) and the oceans are already a serious concern and can increase further to catastrophic levels. Fig. 3 shows this dilemma in a comparison, which really requires no further comment. The oceans are becoming a waste tip and there will be more plastic than fish in the oceans.
2 Global plastic consumption
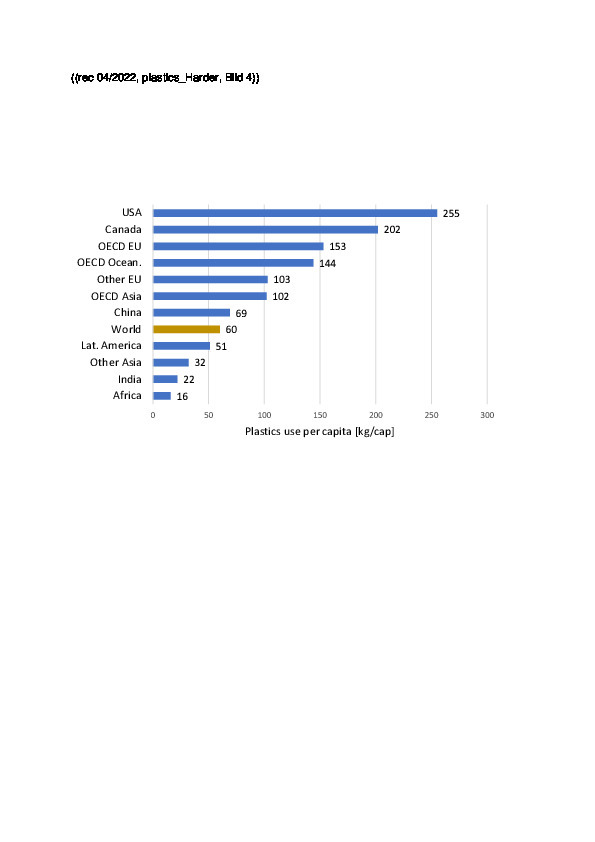
The substantial increase in plastics production over the last ten to twenty years can be attributed to a considerable extent to the rapidly growing consumption in less-developed countries in Asia, Africa and Latin America. However, the current per capita consumption rates should not be neglected (Fig. 4). Clear frontrunners are currently the USA, followed by Canada and the OECD member countries of the EU and Oceania (Australia, New Zealand). The developing countries in Latin America, Asia and Africa, on the other hand, only reach a fraction of the per capita consumption. You only have to imagine the situation when these countries achieve a higher living standard and catch up with the plastic consumption of the developed countries. Various studies expect global consumption to increase from 460 Mta to 600 Mta in 2040.
With regard to consumption in the different countries and regions, weighting by use and type of plastics differs very widely in some cases. Fig. 5 shows the consumption of individual industries in the EU27 + 3 (UK, NO, CH) in 2019. The largest volumes of plastics went into packaging (39.6 %), the construction industry (20.4 %) and the automotive industry (9.6 %). Other consumers include the furniture and textile industry, mechanical engineering and medical technology. In recent years, the largest increase can be attributed to packaging. A breakdown of plastic applications according to the main plastics used is shown in Fig. 6. The key plastics include polypropylene (PP), polyethylene (PE), polyvinylchloride (PVC), polyurethane (PUR) and polyethylene terephthalate (PET).
3 Future challenges
Fig. 7 shows that future challenges not only involve recycling larger volumes of plastic, but that a paradigm shift takes place. The goal is a reduction of ocean pollution to 5 Mta (1 Mta microplastic, 4 Mta macroplastic) by 2040 instead of the 29 Mta with the ‘business as usual’ model. To this end, various measures are necessary. Consumption must be reduced by 130 Mta either by avoiding the use of plastic or reusing it, which would save around 30 % plastic waste. 71 Mta can be substituted by other products. 84 Mta can be recycled if the capacities for mechanical recycling are increased to 86 Mta and those for material-to-material recycling to 13 Mta. 101 Mta must be sent to waste-to-energy processes or to landfills. Uncontrolled disposal must be reduced by 44 Mta. That includes cutting waste exports to critical countries by at least 90 %.
A key precondition is the collection and treatment of plastic waste also in those countries with low to medium income, collection rates of 90 % being achieved in urban areas and of at least 50 % in rural regions. Fig. 8 shows what the current situation and legal regulations are in selected countries in Asia, which are currently some of the countries with the highest ocean pollution rates. Japan and Korea are flagship countries with the strictest regulations. At the other end are countries like Indonesia, Malaysia, Philippines and China, which share responsibility for the high pollution of oceans and where higher standards could effect an improvement of the situation.
Fig. 9 shows the current global situation for the recycling of plastic packaging. Of the total of 134 Mta packaging waste, in the current situation, only 21 % is recyclable [5], while the overwhelming part of 79 % is not recyclable, which in some cases clearly contradicts the figures on recycling rates in the countries and regions. This concerns all the soft plastics, especially large quantities of soft polyethylene and soft polypropylene being collected. The most important recyclable plastics include the hard plastics PET and PE, even if various fractions are considered unrecyclable. All in all, it is important that plastics are collected separately or the different plastic fractions are sorted in recycling facilities.
4 Recycling in the EU and in Germany
In the year 2020, according to provisional figures, a total of 29.5 Mta plastic waste was collected in Europe (EU27 + 3), that is less than 80 % of the plastic waste produced. The percentage of recycled plastic has more than doubled from 4.7 Mta to 10.2 Mta and is now at 34.6 % (Fig, 10) [6]. The main volume of 12.4 Mta (42.0 %) goes into waste-to-energy recycling, 6.9 Mta or 23.4 % of the plastic waste is still landfilled. For the 14.8 Mta plastic packaging waste, recycling has become the most important option. 42.0 % was recycled in 2018, 39.5 % went into incineration and 18.5 % to landfills. The recycling rates for plastic packaging waste vary from country from country between 26 % and 52 %, averaging 42 %. Exports of plastic waste to countries outside the EU have decreased by 39 % since 2006. Since 2021, only exports of recyclate have been allowed, to combat further littering of the seas [7].
In 2018, a total quantity of around 5.0 Mta plastic waste was recycled in the EU. The plastic waste is processed mechanically and chemically and transformed into new plastic products. Around 4.0 Mta of the recyclate remained in Europe, 1.0 Mta was exported. Of the recyclate, 46 % was used for new construction products, 24 % for packaging material, 13 % for agricultural sheeting and 17 % for other plastic products for domestic use, automotive engineering, shoe industry, etc. On the back of the recently experienced raw materials shortages, industry has recognized that there is much greater potential in plastics recycling. In May 2021, Plastics Europe announced that the European plastics manufacturers want to invest in chemical recycling facilities with a total of € 2.6 bill. by 2025 and a total of € 7.2 bill. by 2030.
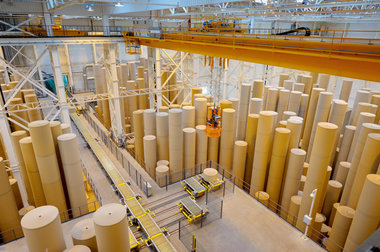
In Germany, from the 6.28 Mta plastic waste calculated for 2019, around 46.4 % was fed to material-to-material recycling and 52.8 % to a waste-to-energy recycling (Fig. 11). Only a very small quantity of 0.6 % was landfilled. The material-to-material recycling rates (recycling rate) have increased by 4.4 % since 2013, those of waste-to-energy recycling have decreased by 4.2 %. Around 1.16 Mta was used as alternative fuel mainly in the cement industry. 2.13 Mta went into waste incineration plants. The output of recyclate amounted to 2.04 Mta. Of the total of around 1.95 Mta recyclate used in Germany, around 1.36 Mta is used to substitute new products, 0.58 Mta is used to substitute materials like concrete, wood and steel, while 0.01 Mta goes into the steelmaking process.
5 Recycling technologies
In the upcoming decades, for a growing consumption of plastic, large recycling capacities have to be installed worldwide, to, starting from around 35 Mta capacity, achieve the goal of 100 Mta. The problem is that in most countries the costs for landfilling and incineration of plastic waste still are considerably lower than the costs for mechanical or chemical recycling plants. While the investment costs for mechanical recycling facilities with a capacity of around 30 000 to 70 000 t/a stand at 5 to 10 mill. US$, the investment costs for chemical plants (pyrolysis, gasification) rapidly increase from 20 to 30 mill. US$. Estimates suggest that from 2021 to 2040, around 105 such plants must be built worldwide each year. To date, however, the revenue of most facilities is too low for them to independently yield any profit.
Fig. 12 shows the principal process steps for mechanical recycling of plastics. The process of collection and sorting of the plastics is very labour-intensive, but a prerequisite for recycling, This is followed by the process steps comminution, separation of plastic fractions, washing and extrusion. The product recovered from this is the recyclate. Depending on the sorting of the plastic waste and the process steps installed, high-purity recyclates can be recovered that, for example, can be reused in food and drinks packaging. Different processes are now available that also require mechanical preparation, but use physical dissolution processes instead of extrusion for material recycling or, however, provide chemical recycling (pyrolysis, gasification or chemical depolymerization).
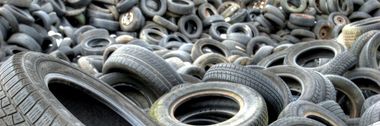
Fig. 13 provides an insight in the current status of worldwide recycling of plastics depending on the type of the polymer. PET and PETE are the plastics best known as drinks bottles and boast the highest recycling rate. For all other plastics shown, only a very low recycling rate is reported. In many cases, recycling there concerns specific industries like e.g. the electronics industry, which has to contend with increasing regulations on the return and recycling of waste equipment. Most polymers cannot be recycled 100 % into starting plastic because of impurities. The term used here is plastic downcycling because the recyclate does not match the quality characteristics of the starting material, but can still be used as fleece for textiles or for construction products instead of for making new bottles.
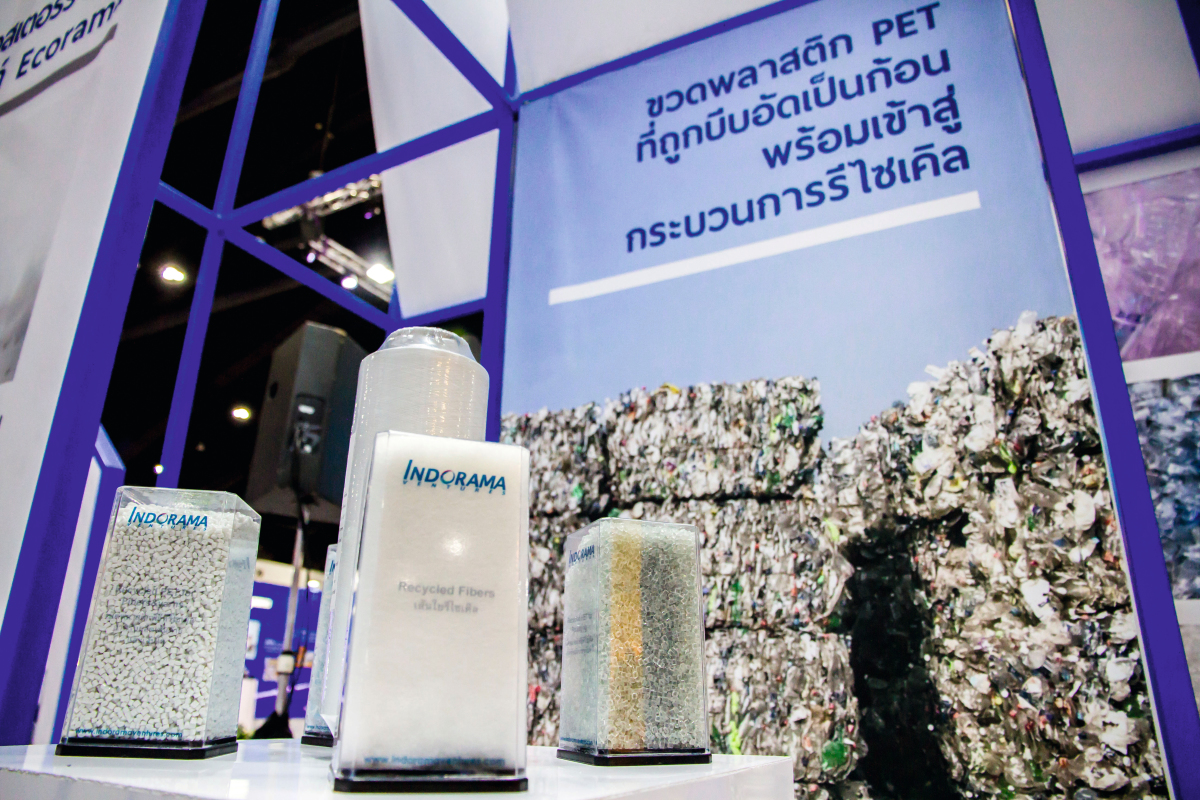
The worldwide leading company in the recycling of PET bottles is the India-based company Indorama Ventures Public Co. Ltd. In 2019, Indorama announced an investment of 1 bill. US$ to increase recycling capacities (Fig. 14). The company now has PET recycling capacity (rPET) totalling around 0.43 Mta, with sites not only in India but in the USA, Mexico, Brazil, Thailand, the Philippines, France, Netherlands and Poland. At present, a total of 11.3 Mta PET and PTA products are produced, making Indorama the biggest PET bottle manufacturer worldwide. By 2050, the company has pledged to increase the rPET capacity to 0.75 Mta or 50 bill. PET bottles per year. The target for the long term is 25 % rPET in production overall. Further investments of 1.5 bill. US$ are planned up to 2025.
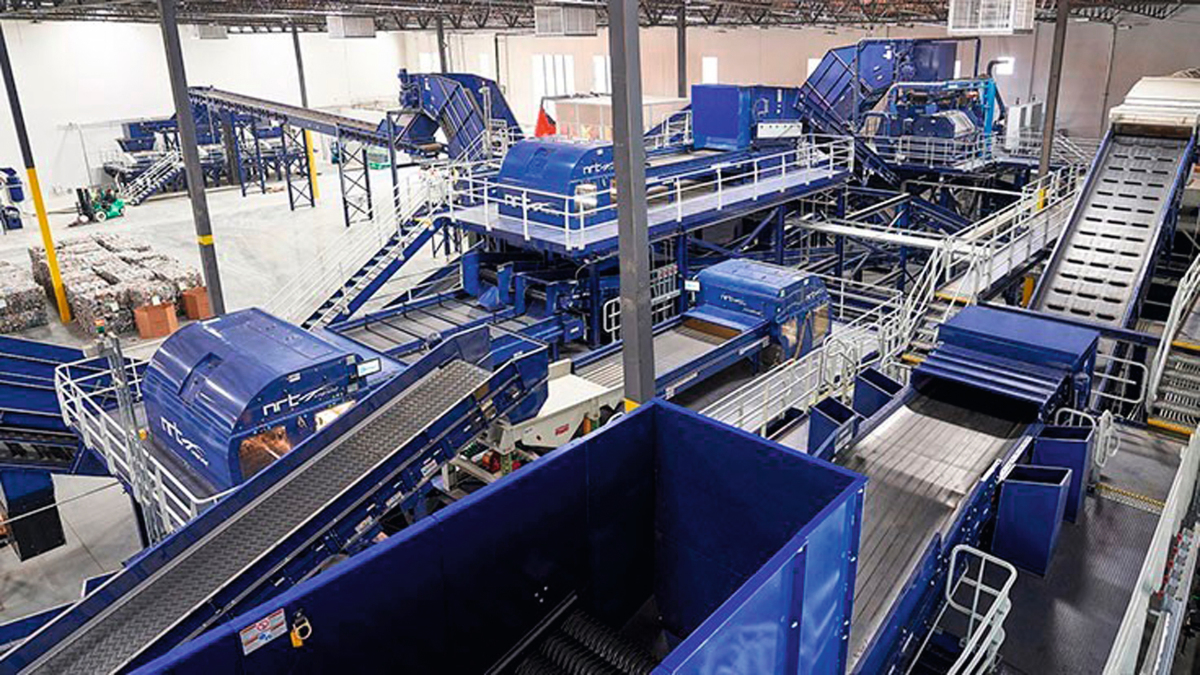
There are now numerous suppliers of mechanical and chemical recycling plants for plastics. In the USA, Bulk Handling Systems (BHS) based in the federal state of Oregon has made a name for itself. Besides plants for construction waste and household waste processing, BHS supplies tailored plants for plastic recycling. For the Californian company rPlanet Earth, it worked in collaboration with the German company Krones, to supply a highly automated recycling plant for post-consumer PET bales (Fig. 15). The plant processes 6 t/h and uses BHS screen, Nihot-air-, NRT-optical and Max-AI robot sorting technologies to produce high-purity, clear PET product for further processing. Five optical NRT sorters with In-Flight Sorting® technology remove metals, mixed plastics and coloured PET and sort positive clear PET.
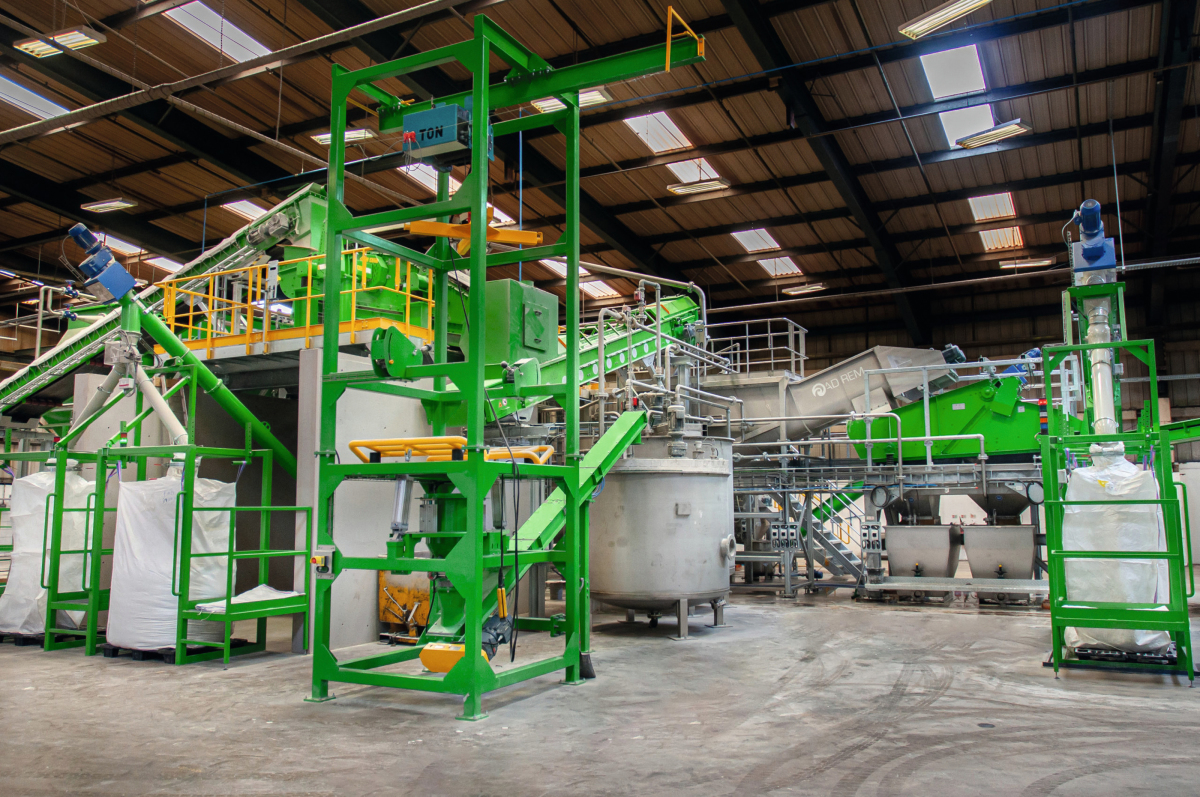
The Belgian company Ad Rem is one of the leading companies for processing waste electrical and electronic equipment and for the recovery of plastics from this waste (Fig. 16). For Stena Technoworld in Halmstad, Sweden, a recycling plant was supplied that processes up to 10 t/h plastic waste. The plant enables separation of waste electrical and electronic equipment (WEEE) into three fractions: PVC-containing material, RDF plastics (RDF = Refuse-Derived Fuels) and recyclable plastics (mixes of PE, PP, ABS and PS). The plastics are separated in a water tank based on their density. The Stena Technoworld plant recirculates around 45 % of input plastics and ensures a reduction of annual CO2 emissions by 1.3 Mta.
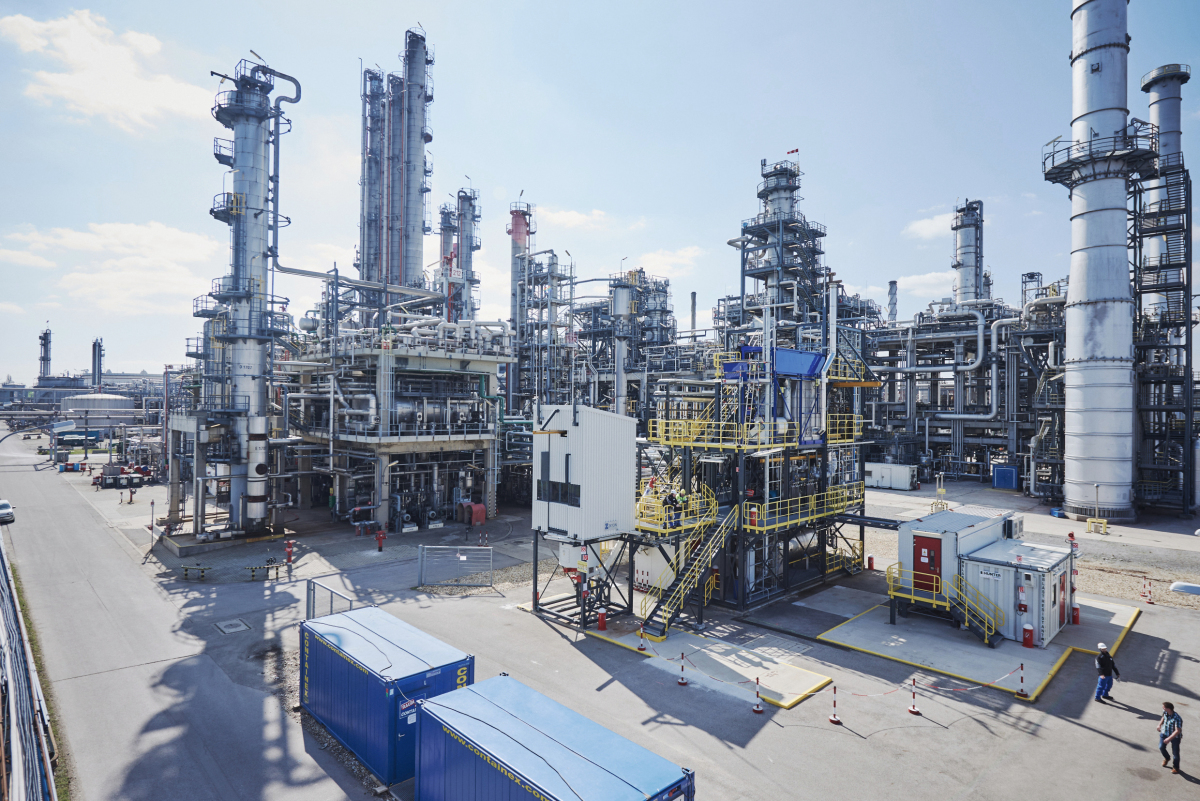
The thermochemical recycling of plastic has so far been considered an alternative process option, unlike incineration processes, which are regarded as a bridging technology until chemical processes have become more established. In pyrolysis, from mixed plastics, short-chain hydrocarbons as oil and gases (e.g. CO, CH4 or H2) and solids (carbonisate) are produced. For chemical recycling, mechanical sorting plants are installed upstream, as a contract awarded by OMV Aktiengesellschaft to ALBA Recycling from this year shows. At OMV, since 2018, in the Schwechat refinery in Austria, a ReOil® pilot plant (Fig. 17) has been in operation. The sorting plant is to help extract polyolefins from a waste fraction. The plant capacity is specified as 0.2 Mta mixed used plastics.
6 Outlook
With a ‘business as usual’ approach, the problems caused by worldwide plastic waste can no longer be controlled. For that reason, it is not just a rethink that is needed, this must be followed by action. Current reports [2; 4 and 5] of the so-called ‘think tanks’ provide crucial suggestions and strategies. According to the report “Breaking the Plastic Wave” [2], the worldwide production of new plastic products (primary plastic) of 400 Mta with ‘business-as-usual’ should be reduced to 181 Mta providing a system change is effected. As a result, the climate gas emissions caused by the plastics industry would be lowered from 2.1 to 1.6 bill. t carbon dioxide (CO2)-emissions (CO2,e) and the annual plastic waste in the oceans reduced from 29 Mta to 5 Mta. A complete stop to the further littering of the oceans is not regarded as feasible. But in total the annual costs for plastic waste disposal can be reduced from 670 to 600 bill. US$.
The topic of CO2 savings in the plastics industry will attract wider interest in future. So far it has been estimated that the plastics industry is responsible for around 2 to 4 % of global CO2 emissions. Plastic packaging accounts for almost 40 % of the value. On the scale of CO2 emissions of the plastics industry (Fig. 18), waste avoidance achieves the lowest value with 0 t CO2,e per tonne while uncontrolled incineration with 6.9 t CO2,e per tonne reaches the highest value. Mechanical recycling stands at a value of 3.5, pyrolysis at 4.4 and fuel production (RDF) at 4.5. Moreover, the composting of bioplastics does not compare well here, either, even if the percentage of compostable plastics at just under 1% can be largely neglected on a global scale.